Plotting
The SystemElements object implements several plotting methods for retrieving standard plotting results. Every plotting method has got the same parameters. The plotter is based on a Matplotlib backend and it is possible to get the figure and do modifications of your own. The x and y coordinates of the model should all be positive value for the plotter to work properly.
Structure
-
SystemElements.show_structure(verbosity=0, scale=1.0, offset=(0, 0), figsize=None, show=True, supports=True, values_only=False)[source]¶ Plot the structure.
Parameters: - verbosity – (int) 0: All information, 1: Suppress information.
- scale – (flt) Scale of the plot.
- offset – (tpl) Offset the plots location on the figure.
- figsize – (tpl) Change the figure size.
- show – (bool) Plot the result or return a figure.
- supports – (bool) Show the supports.
- values_only – (bool) Return the values that would be plotted as tuple containing two arrays: (x, y)
Returns: (figure)
Bending moments
-
SystemElements.show_bending_moment(factor=None, verbosity=0, scale=1, offset=(0, 0), figsize=None, show=True, values_only=False)[source]¶ Plot the bending moment.
Parameters: - factor – (flt) Influence the plotting scale.
- verbosity – (int) 0: All information, 1: Suppress information.
- scale – (flt) Scale of the plot.
- offset – (tpl) Offset the plots location on the figure.
- figsize – (tpl) Change the figure size.
- show – (bool) Plot the result or return a figure.
- values_only – (bool) Return the values that would be plotted as tuple containing two arrays: (x, y)
Returns: (figure)
Axial forces
-
SystemElements.show_axial_force(factor=None, verbosity=0, scale=1, offset=(0, 0), figsize=None, show=True, values_only=False)[source]¶ Plot the axial force.
Parameters: - factor – (flt) Influence the plotting scale.
- verbosity – (int) 0: All information, 1: Suppress information.
- scale – (flt) Scale of the plot.
- offset – (tpl) Offset the plots location on the figure.
- figsize – (tpl) Change the figure size.
- show – (bool) Plot the result or return a figure.
- values_only – (bool) Return the values that would be plotted as tuple containing two arrays: (x, y)
Returns: (figure)
Shear forces
-
SystemElements.show_shear_force(factor=None, verbosity=0, scale=1, offset=(0, 0), figsize=None, show=True, values_only=False)[source]¶ Plot the shear force. :param factor: (flt) Influence the plotting scale. :param verbosity: (int) 0: All information, 1: Suppress information. :param scale: (flt) Scale of the plot. :param offset: (tpl) Offset the plots location on the figure. :param figsize: (tpl) Change the figure size. :param show: (bool) Plot the result or return a figure. :param values_only: (bool) Return the values that would be plotted as tuple containing two arrays: (x, y) :return: (figure)
Reaction forces
-
SystemElements.show_reaction_force(verbosity=0, scale=1, offset=(0, 0), figsize=None, show=True)[source]¶ Plot the reaction force.
Parameters: - verbosity – (int) 0: All information, 1: Suppress information.
- scale – (flt) Scale of the plot.
- offset – (tpl) Offset the plots location on the figure.
- figsize – (tpl) Change the figure size.
- show – (bool) Plot the result or return a figure.
Returns: (figure)
Displacements
-
SystemElements.show_displacement(factor=None, verbosity=0, scale=1, offset=(0, 0), figsize=None, show=True, linear=False, values_only=False)[source]¶ Plot the displacement.
Parameters: - factor – (flt) Influence the plotting scale.
- verbosity – (int) 0: All information, 1: Suppress information.
- scale – (flt) Scale of the plot.
- offset – (tpl) Offset the plots location on the figure.
- figsize – (tpl) Change the figure size.
- show – (bool) Plot the result or return a figure.
- linear – (bool) Don’t evaluate the displacement values in between the elements
- values_only – (bool) Return the values that would be plotted as tuple containing two arrays: (x, y)
Returns: (figure)
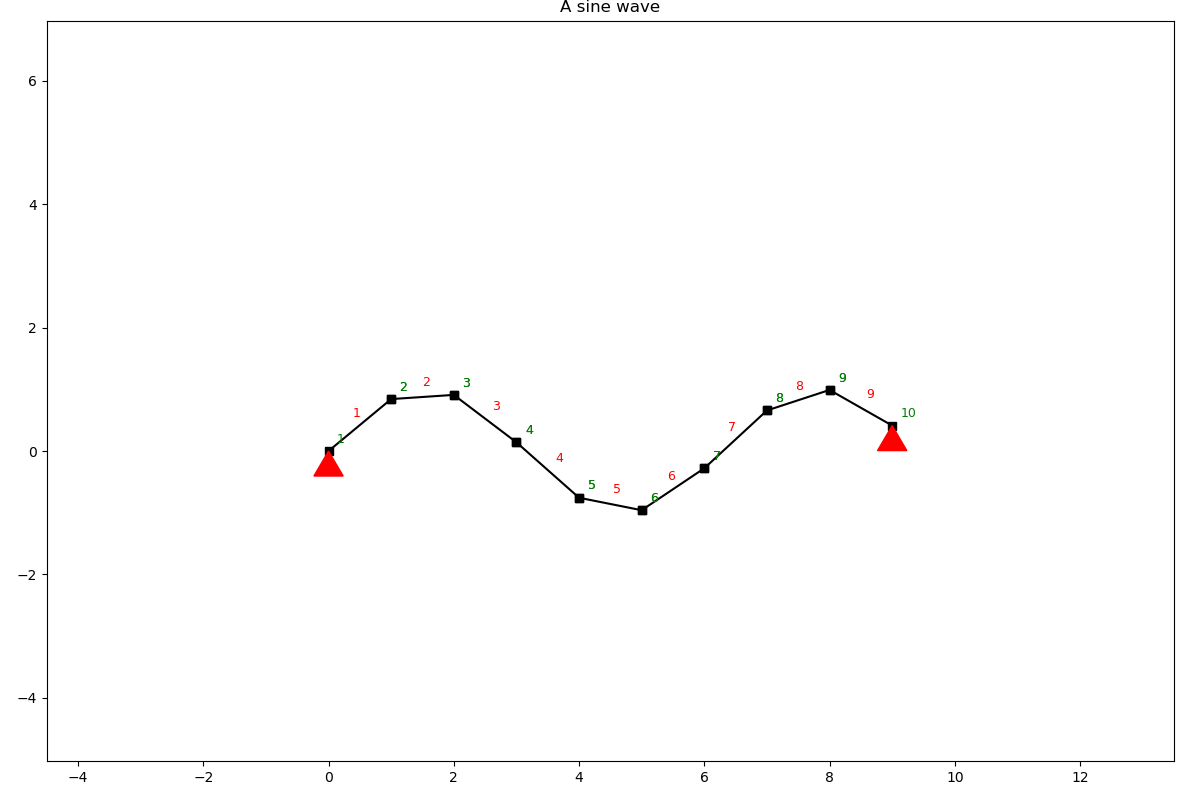
Save figure
When the show parameter is set to False a Matplotlib figure is returned and the figure can be saved with proper titles.
from anastruct import SystemElements
import numpy as np
import matplotlib.pyplot as plt

x = np.arange(0, 10)
y = np.sin(x)

ss = SystemElements()
ss.add_element_grid(x, y)
ss.add_support_hinged(node_id=[1, -1])

fig = ss.show_structure(show=False)
plt.title('A sine wave')
plt.savefig('my-figure.png')