Examples
Examples below a side variety of the structures which aim to show capabilities of the package. The same as any other packages, anaStruct should be called and imported.
import anastruct as anas
And for a mater of minimalism and making calls and coding more efficient, different classes can be called separately.
1anas.LoadCase
2anas.LoadCombination
3anas.SystemElements
4anas.Vertex
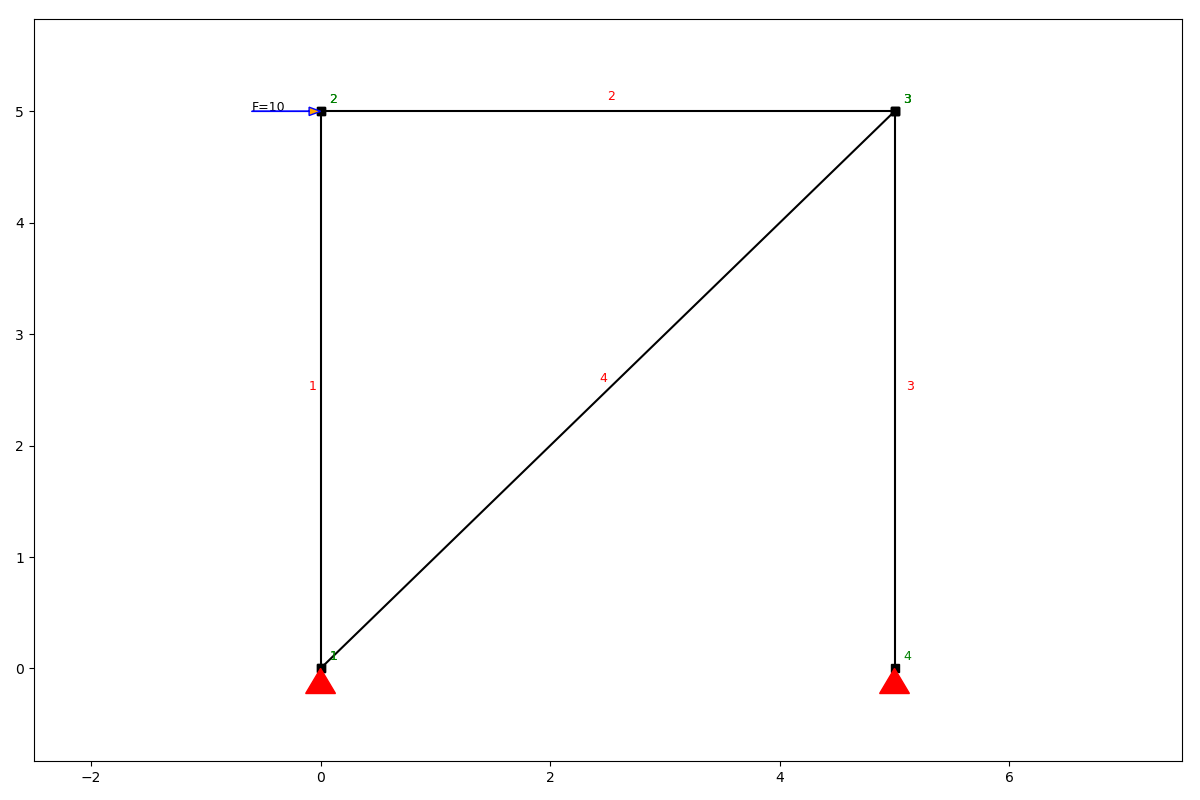
Simple example - Truss
1ss = SystemElements(EA=5000)
2ss.add_truss_element(location=[[0, 0], [0, 5]])
3ss.add_truss_element(location=[[0, 5], [5, 5]])
4ss.add_truss_element(location=[[5, 5], [5, 0]])
5ss.add_truss_element(location=[[0, 0], [5, 5]], EA=5000 * math.sqrt(2))
6
7ss.add_support_hinged(node_id=1)
8ss.add_support_hinged(node_id=4)
9
10ss.point_load(Fx=10, node_id=2)
11
12ss.solve()
13ss.show_structure()
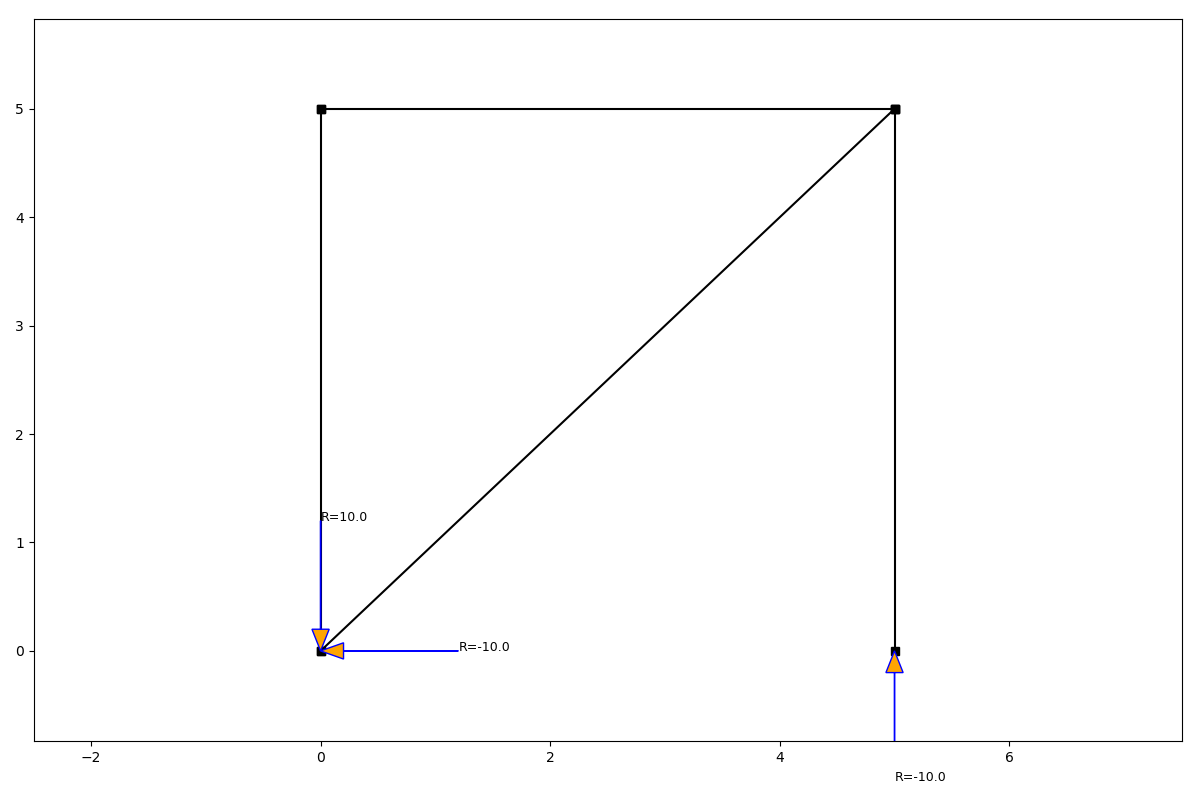
14ss.show_reaction_force()
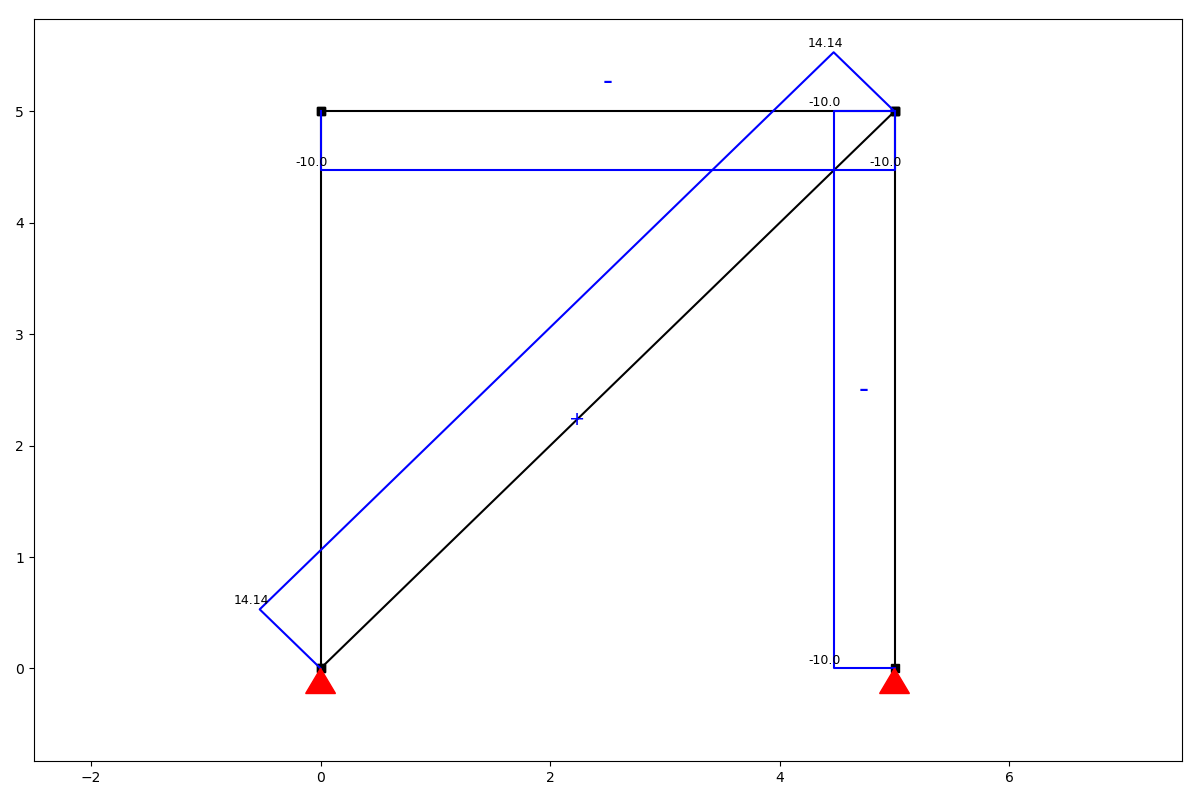
15ss.show_axial_force()
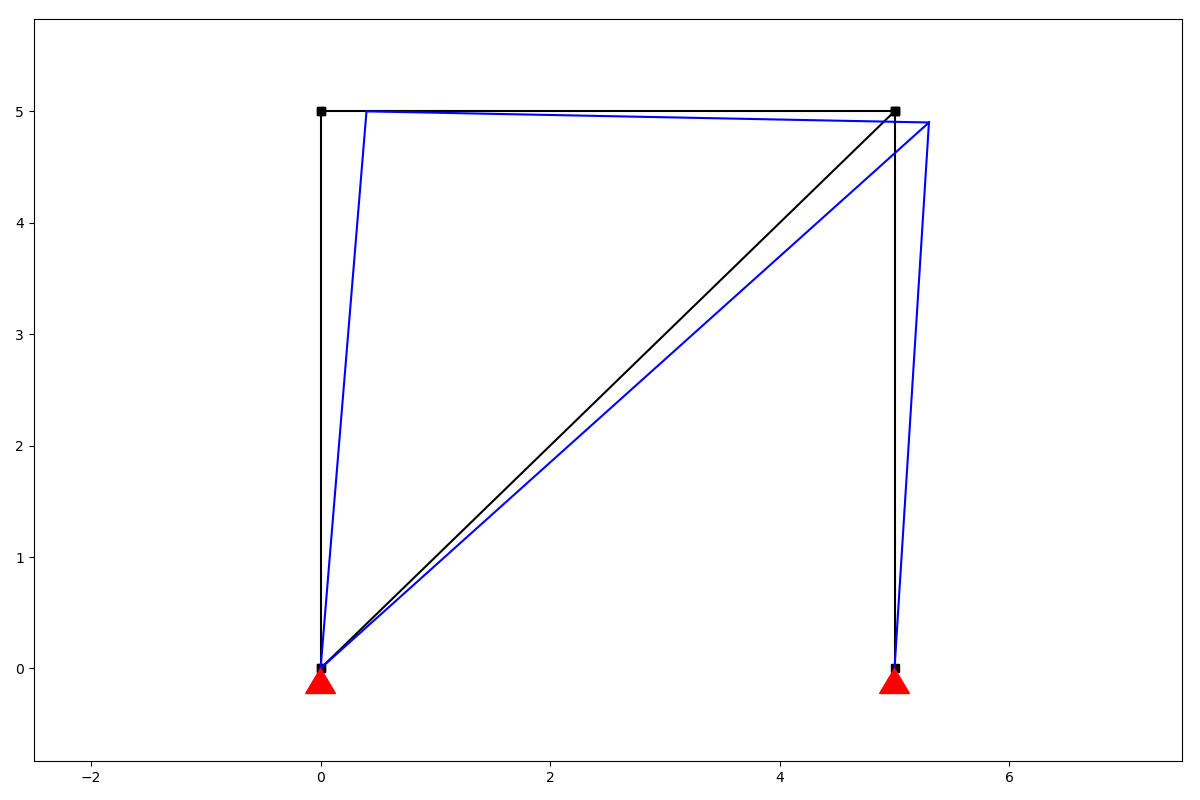
16ss.show_displacement(factor=10)
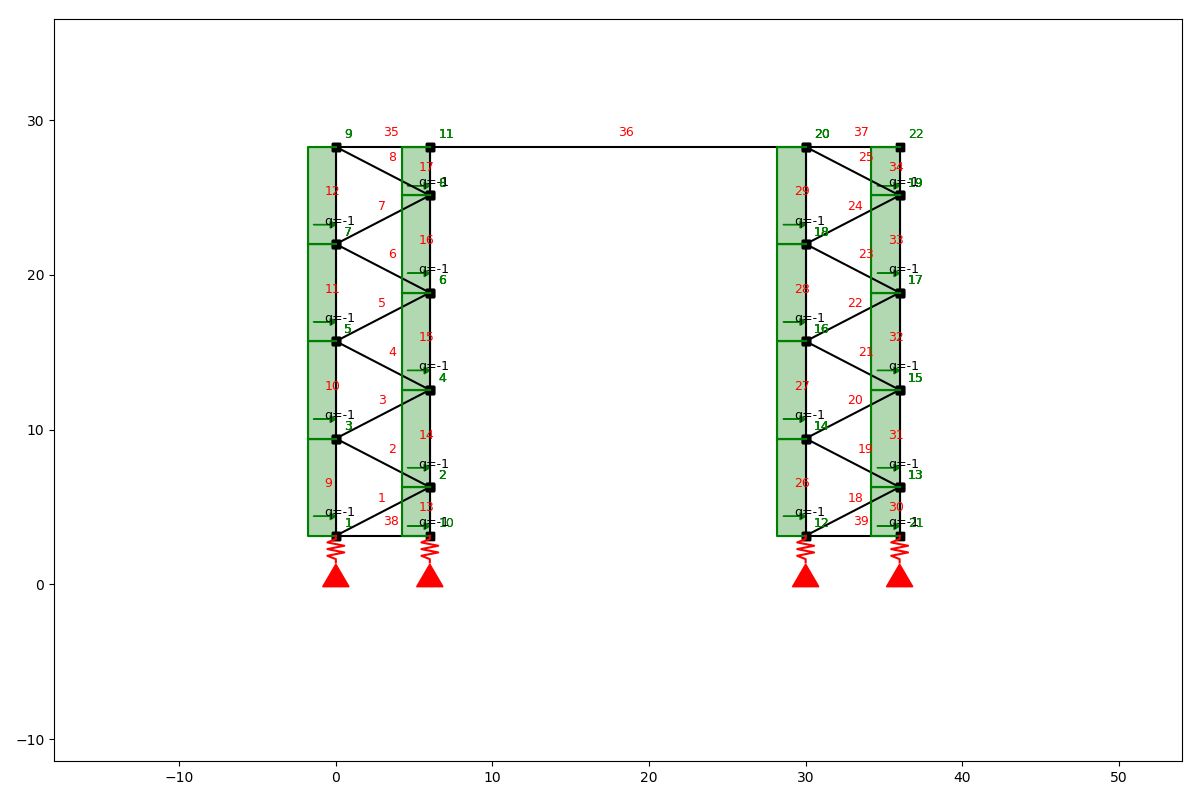
Intermediate
1from anastruct import SystemElements
2import numpy as np
3
4ss = SystemElements()
5element_type = 'truss'
6
7# Create 2 towers
8width = 6
9span = 30
10k = 5e3
11
12# create triangles
13y = np.arange(1, 10) * np.pi
14x = np.cos(y) * width * 0.5
15x -= x.min()
16
17for length in [0, span]:
18 x_left_column = np.ones(y[::2].shape) * x.min() + length
19 x_right_column = np.ones(y[::2].shape[0] + 1) * x.max() + length
20
21 # add triangles
22 ss.add_element_grid(x + length, y, element_type=element_type)
23 # add vertical elements
24 ss.add_element_grid(x_left_column, y[::2], element_type=element_type)
25 ss.add_element_grid(x_right_column, np.r_[y[0], y[1::2], y[-1]], element_type=element_type)
26
27 ss.add_support_spring(
28 node_id=ss.find_node_id(vertex=[x_left_column[0], y[0]]),
29 translation=2,
30 k=k)
31 ss.add_support_spring(
32 node_id=ss.find_node_id(vertex=[x_right_column[0], y[0]]),
33 translation=2,
34 k=k)
35
36# add top girder
37ss.add_element_grid([0, width, span, span + width], np.ones(4) * y.max(), EI=10e3)
38
39# Add stability elements at the bottom.
40ss.add_truss_element([[0, y.min()], [width, y.min()]])
41ss.add_truss_element([[span, y.min()], [span + width, y.min()]])
42
43for el in ss.element_map.values():
44 # apply wind load on elements that are vertical
45 if np.isclose(np.sin(el.angle), 1):
46 ss.q_load(
47 q=1,
48 element_id=el.id,
49 direction='x'
50 )
51
52ss.show_structure()
53ss.solve()
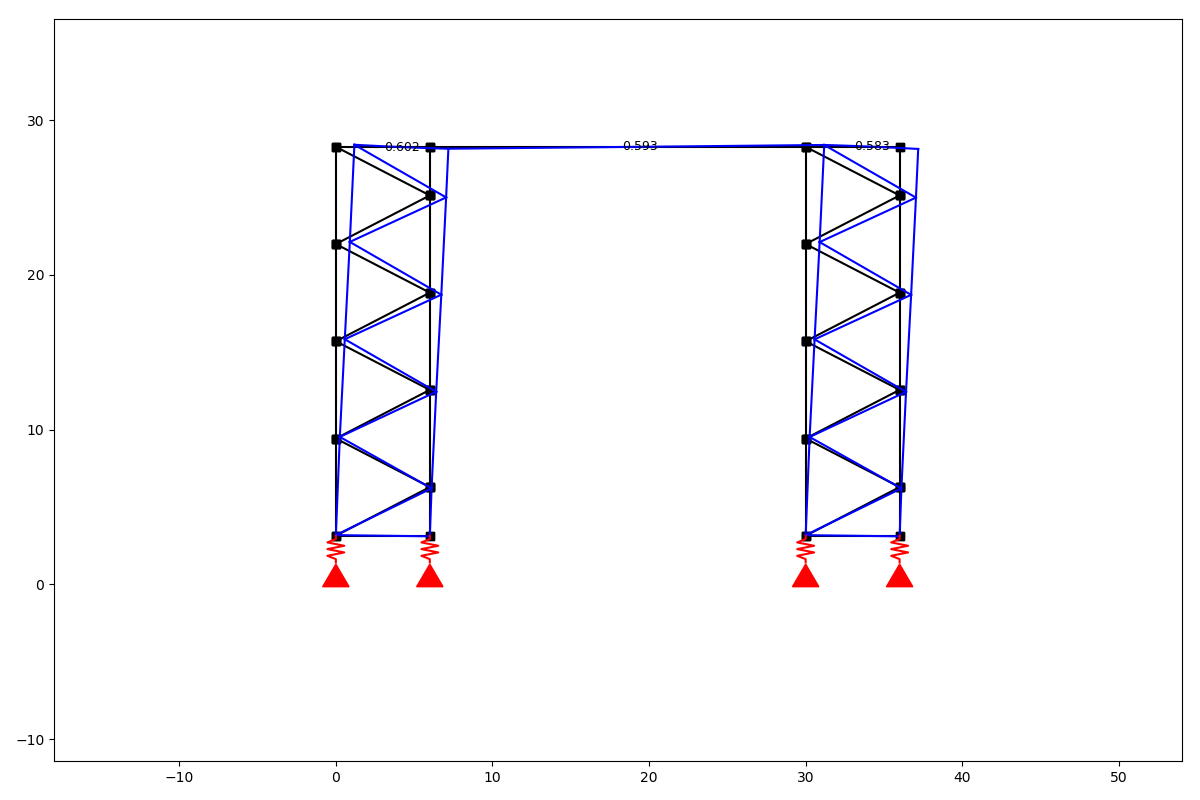
54ss.show_displacement(factor=2)
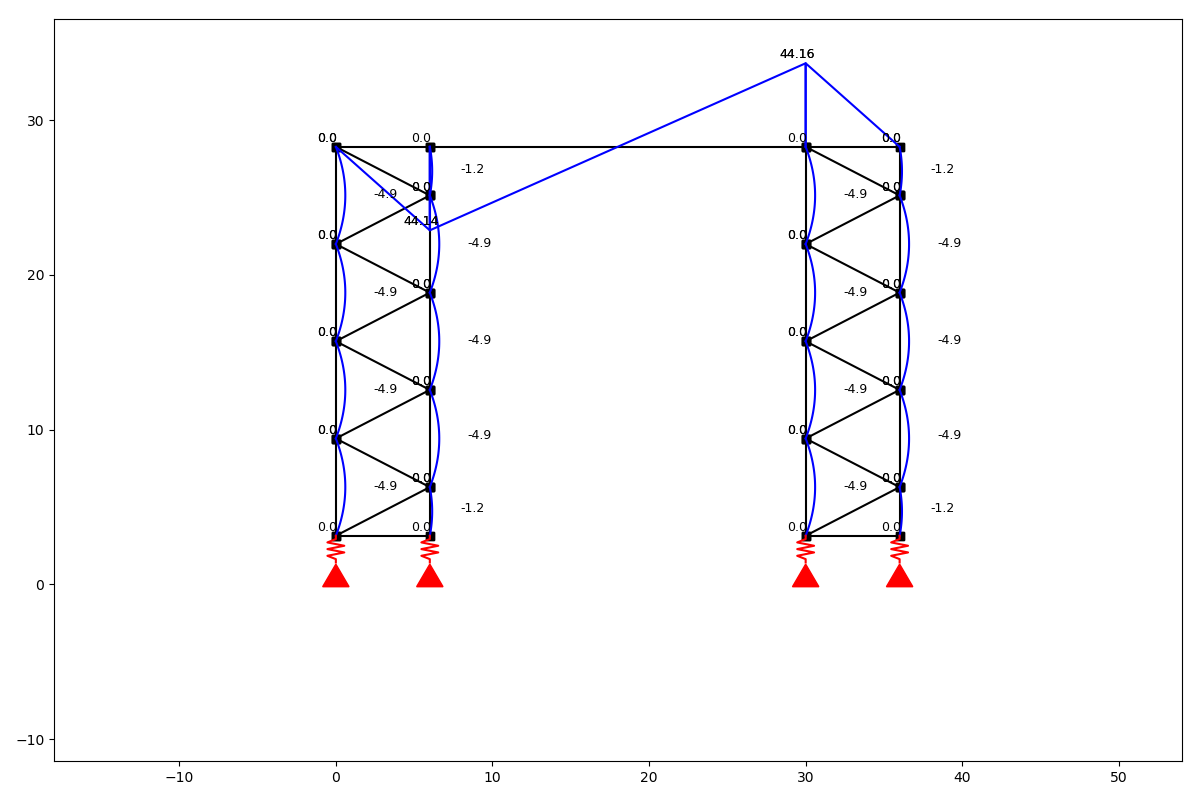
55ss.show_bending_moment()
Advanced
Take a look at this blog post. Here anaStruct was used to do a non linear water accumulation analysis. Water accumulation blog post.
  1# import dependencies
  2import matplotlib.pyplot as plt
  3from anastruct.basic import converge
  4from anastruct.material.profile import HEA, IPE
  5from anastruct.fem.system import SystemElements, Vertex
  6from anastruct.material.units import to_kNm2, to_kN
  7
  8# constants
  9E = 2.1e5  # Construction steels Young's modulus
 10b = 5  # c.t.c distance portals
 11q_water = 10
 12
 13# axes height levels
 14h_1 = 0
 15h_2 = 0.258
 16h_3 = 0.046
 17h_4 = 0.274
 18h_5 = 0.032
 19h_6 = 0.15
 20
 21# beam spans
 22span_1 = span_2 = 21.9
 23span_3 = 8.9
 24
 25# Vertices at the axes
 26p1 = Vertex(0, h_1)
 27p2 = Vertex(span_1 * 0.5, h_2)
 28p3 = Vertex(span_1, h_3)
 29p4 = Vertex(span_1 + span_2 * 0.5, h_4)
 30p5 = Vertex(span_1 + span_2, h_5)
 31p6 = Vertex(span_1 + span_2 + span_3, h_6)
 32
 33def structure():
 34    """
 35    Build the structure from left to right, starting at axis 1.
 36
 37    variables:
 38    EA = Young's modulus * Area
 39    EI = Young's modulus * moment of Inertia
 40    g = Weight [kN/ m]
 41    elements = reference of the element id's that were created
 42    dl = c.t.c distance different nodes.
 43    """
 44
 45    dl = 0.2
 46
 47
 48    ## SPAN 1 AND 2
 49
 50    # The elements between axis 1 and 3 are an IPE 450 member.
 51    EA = to_kN(E * IPE[450]['A'])  # Y
 52    EI = to_kNm2(E * IPE[450]["Iy"])
 53    g = IPE[450]['G'] / 100
 54
 55    # New system.
 56    ss = SystemElements(mesh=3, plot_backend="mpl")
 57
 58    # span 1
 59    first = dict(
 60        spring={1: 9e3},
 61        mp={1: 70},
 62    )
 63
 64    elements = ss.add_multiple_elements(location=[p1, p2], dl=dl, first=first, EA=EA, EI=EI, g=g)
 65    elements += ss.add_multiple_elements(location=p3, dl=dl, EA=EA, EI=EI, g=g)
 66
 67    # span 2
 68    first = dict(
 69        spring={1: 40e3},
 70        mp={1: 240}
 71    )
 72    elements += ss.add_multiple_elements(location=p4, dl=dl, first=first, EA=EA, EI=EI, g=g)
 73    elements += ss.add_multiple_elements(location=p5, dl=dl, EA=EA, EI=EI, g=g)
 74
 75
 76    ## SPAN 3
 77
 78    # span 3
 79    # different IPE
 80    g = IPE[240]['G'] / 100
 81    EA = to_kN(E * IPE[240]['A'])
 82    EI = to_kNm2(E * IPE[240]["Iy"])
 83    first = dict(
 84        spring={1: 15e3},
 85        mp={1: 25},
 86    )
 87
 88    elements += ss.add_multiple_elements(location=p6, first=first, dl=dl, EA=EA, EI=EI, g=g)
 89
 90    # Add a dead load of -2 kN/m to all elements.
 91    ss.q_load(-2, elements, direction="y")
 92
 93
 94    ## COLUMNS
 95
 96    # column height
 97    h = 7.2
 98
 99    # left column
100    EA = to_kN(E * IPE[220]['A'])
101    EI = to_kNm2(E * HEA[220]["Iy"])
102    left = ss.add_element([[0, 0], [0, -h]], EA=EA, EI=EI)
103
104    # right column
105    EA = to_kN(E * IPE[180]['A'])
106    EI = to_kNm2(E * HEA[180]["Iy"])
107    right = ss.add_element([p6, Vertex(p6.x, -h)], EA=EA, EI=EI)
108
109
110    ## SUPPORTS
111
112    # node ids for the support
113    id_left = max(ss.element_map[left].node_map.keys())
114    id_top_right = min(ss.element_map[right].node_map.keys())
115    id_btm_right = max(ss.element_map[right].node_map.keys())
116
117    # Add supports. The location of the supports is defined with the nodes id.
118    ss.add_support_hinged((id_left, id_btm_right))
119
120    # Retrieve the node ids at axis 2 and 3
121    id_p3 = ss.find_node_id(p3)
122    id_p5 = ss.find_node_id(p5)
123
124    ss.add_support_roll(id_top_right, direction=1)
125
126    # Add translational spring supports at axes 2 and 3
127    ss.add_support_spring(id_p3, translation=2, k=2e3, roll=True)
128    ss.add_support_spring(id_p5, translation=2, k=3e3, roll=True)
129    return ss
130
131ss = structure()
132ss.show_structure(verbosity=1, scale=0.6)
133
134def water_load(ss, water_height, deflection=None):
135    """
136    :param ss: (SystemElements) object.
137    :param water_height: (flt) Water level.
138    :param deflection: (array) Computed deflection.
139    :return (flt) The cubic meters of water on the structure
140    """
141
142    # The horizontal distance between the nodes.
143    dl = np.diff(ss.nodes_range('x'))
144
145    if deflection is None:
146        deflection = np.zeros(len(ss.node_map))
147
148    # Height of the nodes
149    y = np.array(ss.nodes_range('y'))
150
151    # An array with point loads.
152    # cubic meters * weight water
153    force_water = (water_height - y[:-3] - deflection[:-3]) * q_water * b * dl[:-2]
154
155    cubics = 0
156    n = force_water.shape[0]
157    for k in ss.node_map:
158        if k > n:
159            break
160        point_load = force_water[k - 1]
161
162        if point_load > 0:
163            ss.point_load(k, Fx=0, Fz=-point_load)
164            cubics += point_load / q_water
165
166    return cubics
167
168def det_water_height(c, deflection=None):
169    """
170    :param c: (flt) Cubic meters.
171    :param deflection: (array) Node deflection values.
172    :return (SystemElement, flt) The structure and the redistributed water level is returned.
173    """
174    wh = 0.1
175
176    while True:
177        ss = structure()
178        cubics = water_load(ss, wh, deflection)
179
180        factor = converge(cubics, c)
181        if 0.9999 <= factor <= 1.0001:
182            return ss, wh
183
184        wh *= factor
185
186cubics = [0]
187water_heights = [0]
188
189a = 0
190deflection = None
191max_water_level = 0
192
193# Iterate from 8 m3 to 15 m3 of water.
194
195for cubic in range(80, 150, 5):  # This loop computes the results per m3 of storaged water.
196    wh = 0.05
197    lastwh = 0.2
198    cubic /= 10
199
200    print(f"Starting analysis of {cubic} m3")
201
202    c = 1
203    for _ in range(100):  # This loop redistributes the water until the water level converges.
204
205        # redistribute the water
206        ss, wh = det_water_height(cubic, deflection)
207
208        # Do a non linear calculation!!
209        ss.solve(max_iter=100, verbosity=1)
210        deflection = ss.get_node_result_range("uy")
211
212        # Some breaking conditions
213        if min(deflection) < -1:
214            print(min(deflection), "Breaking due to exceeding max deflection")
215            break
216        if 0.9999 < lastwh / wh < 1.001:
217            print(f"Convergence in {c} iterations.")
218            cubics.append(cubic)
219            water_heights.append(wh)
220            break
221
222        lastwh = wh
223        c += 1
224
225    if wh > max_water_level:
226        max_water_level = wh
227    else:
228        a += 1
229        if a >= 2:
230            print("Breaking. Water level isn't rising.")
231            break
232
233plt.plot(ss.nodes_range('x')[:-2], [el.bending_moment[0] for el in list(ss.element_map.values())[:-1]])
234a = 0
235plt.plot([0, p6.x], [a, a], color="black")
236
237c = "red"
238a = 240
239plt.plot([p3.x - 5, p3.x + 5], [a, a], color=c)
240a = 25
241plt.plot([p5.x - 5, p5.x + 5], [a, a], color=c)
242a = 70
243plt.plot([p1.x - 5, p1.x + 5], [a, a], color=c)
244
245plt.ylabel("Bending moment [kNm]")
246plt.xlabel("Span [m]")
247plt.show()
248
249plt.plot(ss.nodes_range('x')[:-2], ss.nodes_range('y')[:-2])
250plt.plot(ss.nodes_range('x')[:-2], [a + b for a, b in zip(ss.nodes_range('y')[:-2], ss.get_node_result_range("uy")[:-2])])
251
252plt.ylabel("Height level roof when accumulating [m]")
253plt.xlabel("Span [m]")
254plt.show()